
Policy Counteracts Emissions Through Market Intervention – #2c

I may have been a little misleading, inflammatory even, when I said “governments (and not markets) are responsible for emissions” in post #2a. I skipped over the most important question – ‘who pays’ when carbon pricing policy exists?
Governments do not pay the full cost of decarbonization or carbon removal. For a government to foot the bill, the cost gets passed on to its citizens. If governments printed money to pay the costs, citizens may not see the cost but may be subject to currency inflation. However, governments do use policy to intervene in markets within their jurisdiction.
Putting a price on corporate emissions still passes costs on to consumers, BUT it means innovative companies that reduces emissions have a competitive advantage in the market. Theoretically, this reduces the impact of carbon pricing on consumer purchases. This is to say that governments do not necessarily have to pay for emissions reduction or removal because they have the power to pass policy that makes low-, no-, and negative-carbon products more attractive in the market.
How much does a decarbonized world cost?
When decarbonization costs reach a consumer, its typically called a ‘green premium’. Green premiums are probably most relevant when analyzing consumer behavior and Demand for low-carbon products. The lower the green premium, the less the effect on consumer spending.
Today, we’re diving into the MAC (marginal abatement cost) curve!1 A MAC curve is similar to the ‘green premium’, with a small difference. MAC curves are useful when analyzing the cost of Supplying low-carbon products. This is a technology-first look at the cost to achieve decarbonization. It emphasizes the most cost-effective way to prevent GHGs, not the likelihood of consumer demand when a low-carbon product is more expensive.
Here’s an example if it helps:
Let’s say cement costs $100 per ton, emits 0.8tCO2 per ton of cement, and it costs $60/tCO2 to avoid 90% of those emissions through CCS. In a MAC curve, this is represented by 0.72tCO2 at $60/tCO2 with 0.08tCO2 unabated.2 It also means that the price of low-carbon cement would be at least $143.2 per ton (a $43.2 green premium) but have a carbon footprint of only 0.08tCO2 per ton of cement.3 Until an applicable carbon price exceeds $60/tCO2 or a consumer is willing to pay an extra 43% for cement, the producer is under-incentivized to avoid emissions.
Full analysis of market dynamics would probably combine green premium and MAC curve analysis. However, most emissions come from infrastructure where there is little room for consumer preference, so I prefer MAC curves. One of my favorite MAC curves comes from Goldman Sachs’ Carbonomics report. They attempt to calculate the cost of avoiding (‘conserving’ in their jargon) every anthropogenic GHG emission. This includes the cost of displacing every emission with cleantech including renewables, hydrogen, electric vehicles, batteries, etc.
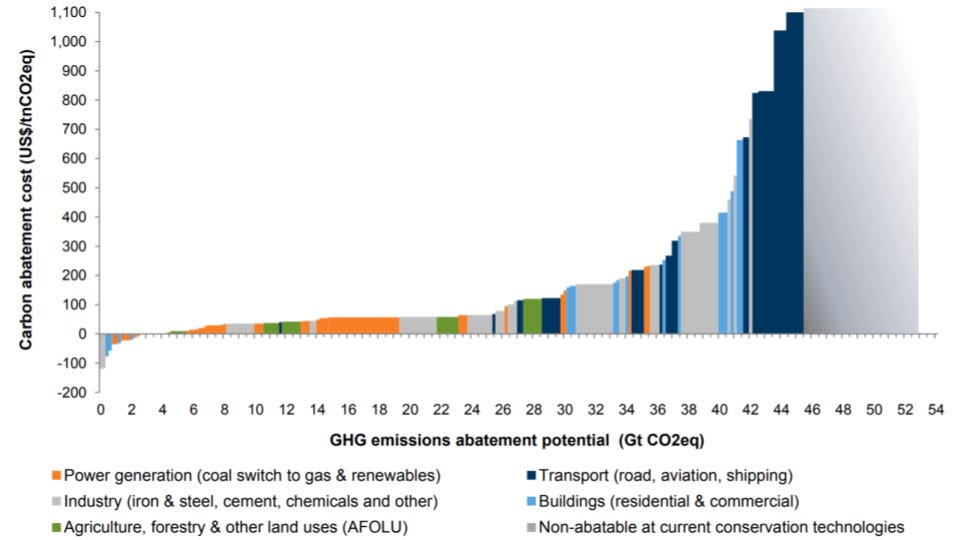
You’ll notice a few gigatons of abatement have negative costs. There are tons of opportunities to replace lightbulbs, improve insulation, go solar, and save money. However, this is not an economy wide solution, just low-hanging fruit. About half of all GHGs cost more than $100/tCO2 to eliminate, or are non-abatable with current tech.
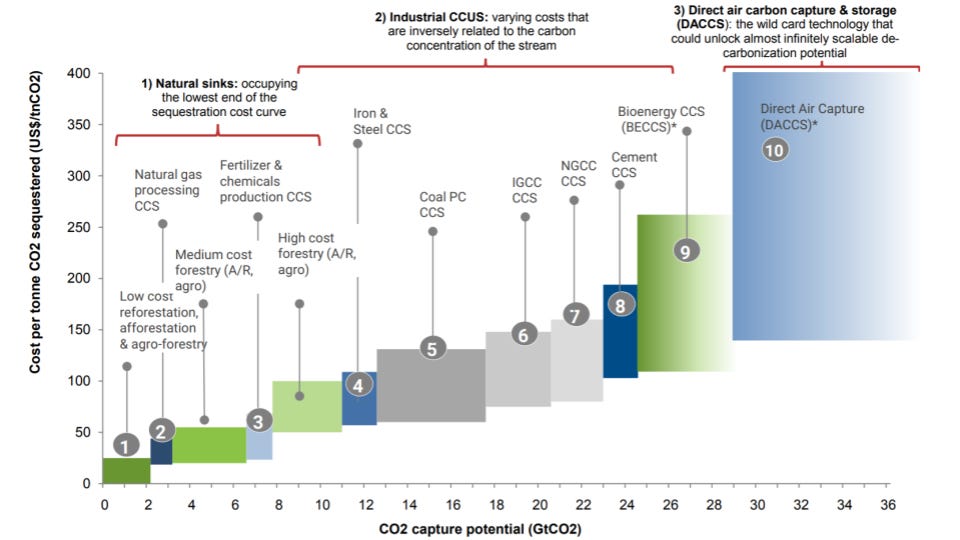
The ‘conservation’ MAC curve excludes any ‘sequestration’ activities like CCS and carbon removal. The Carbonomics team say these net-zero enabling technologies have large uncertainty ranges and little deployed scale. With those caveats, they also provide a ‘sequestration’ MAC curve.
The Carbonomics Party Trick
Goldman Sachs merges the two datasets above to build a MAC curve for the most cost-effective way to achieve net-zero GHGs. In a tip-of-the-hat to the [apparent] unlimited scalability of direct air carbon capture and storage (DACCS), it could be used as the most cost-effective way to eliminate 4–7GtCO2/yr of the hardest-to-abate anthropogenic emissions in a net-zero GHG world. That scale-range assumes the cost of DACCS falls between $180–400/tCO2.
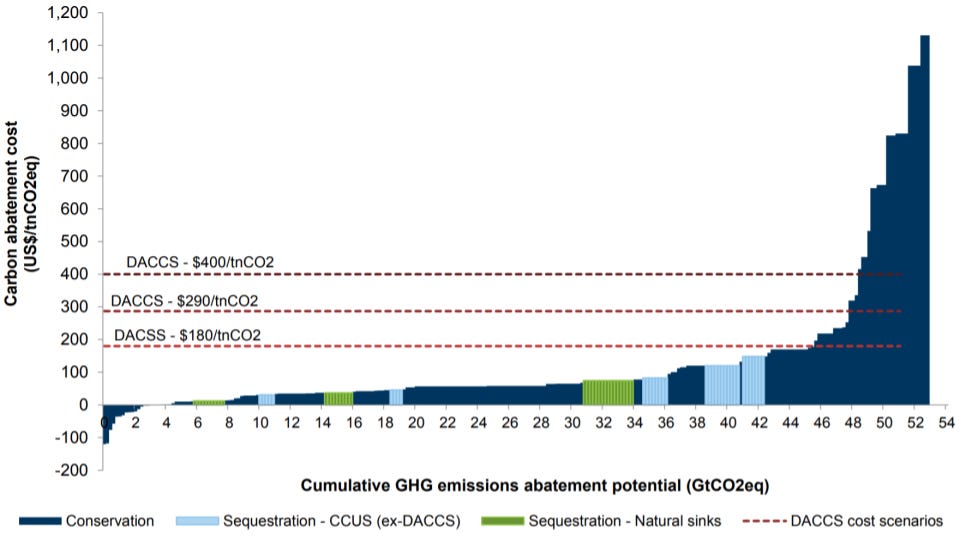
I find this the most interesting curve in the report. From the merged MAC curve, you can see that roughly 60% of GHGs can be eliminated for less than $100/tCO2
So what’s this have to do with carbon pricing policy?
Pretty much everything.
To stay on track to prevent 1.5°C global warming, the world must reduce emissions to roughly 50% of today’s level by 2030. That’s a reduction of 15–25GtCO2/yr. Getting there requires the average global carbon price to be at nearly $55–65/tCO2. At first glance, this looks like a bargain! Compared to the IEA’s net-zero by 2050 report I referenced last time, the Advanced economies should have CO2 prices at $130/t, and China, Russia, Brazil, and South Africa should be at $90/t by 2030.
Where the math gets complicated is when it comes to Where emissions come from compared to Where policy is priced. The MAC curve above is for Global decarbonization – reducing the appropriate carbon price to ~$60/t by 2030 misses a lot of nuance.
Only one-third (roughly) of emissions come from Advanced economies. Will China really achieve $90/t by 2030? The U.S. (15% of global emissions) doesn’t look like it has any plans to reach the $130/t mark by 2030. Together these issues mean achieving a global average carbon price in the $55–65/tCO2 range by 2030 is questionable at best.
Of course, it’s fair to expect there will be high-priced outliers, like the EU and Canada. We can hope their example causes renewed vigor at each COP meeting.
If high-quality, low-cost carbon removal supply already existed at gigaton scale, the 2030 price could be lower, and less cost would get passed on to Earth’s citizenry. However, total carbon removal supply is unlikely to exceed 1.0–1.5GtCO2/yr by then.
Sadly, this points out a weakness in MAC curves – they lack time-dependent effects and deployment rate limitations. In the next few weeks, I will explore deployment rates for carbon removal. If you are Anticarbon and love deploying emission abating technology, please subscribe.
I love MAC curves, so pardon the exclamation points.
0.8tCO2 * 90% avoided = 0.72tCO2
$100 per ton of cement + (0.8tCO2 * 90% avoided * $60/tCO2) = $143.2 per ton of cement. Avoiding 0.72tCO2 from the original 0.80tCO2 leave 0.08tCO2 unabated.